This article will guide you quickly on How to Deploy Metrics servers in Kubernetes cluster which will monitor resource utilization of the resources such as CPU, Memory, network and disk utilization of your POD and kubernetes cluster nodes.
Once you deploy your kubernetes cluster you may need to monitor the same on utilization front. Like you need to gather the current utilization of the resources of the cluster nodes and PODS. There are a number of open-source solutions available today, such as the Metrics-Server, Prometheus,Elastic Stack, and proprietary solutions like Datadog and Dynatrace.
However in this article we are going to learn How to Deploy Metrics servers in Kubernetes cluster which will monitor your resources.
Steps:
- Clone the yaml scripts required for spinning up the Metrics server.
git clone https://github.com/manmohanmirkar123/kubernetes-metics-server.git
- Change the directory to kubernetes-metics-server
# cd kubernetes-metics-server/
- Spin the metrics server using kubectl create command as below:
# kubectl create -f .
Execution logs of the kubectl create command is as below:
root@kubemaster# kubectl create -f .
clusterrole.rbac.authorization.k8s.io/system:aggregated-metrics-reader created
clusterrolebinding.rbac.authorization.k8s.io/metrics-server:system:auth-delegator created
rolebinding.rbac.authorization.k8s.io/metrics-server-auth-reader created
apiservice.apiregistration.k8s.io/v1beta1.metrics.k8s.io created
serviceaccount/metrics-server created
deployment.apps/metrics-server created
service/metrics-server created
clusterrole.rbac.authorization.k8s.io/system:metrics-server created
clusterrolebinding.rbac.authorization.k8s.io/system:metrics-server created
root@kubemaster#
Recheck its been deployed or not using below command:
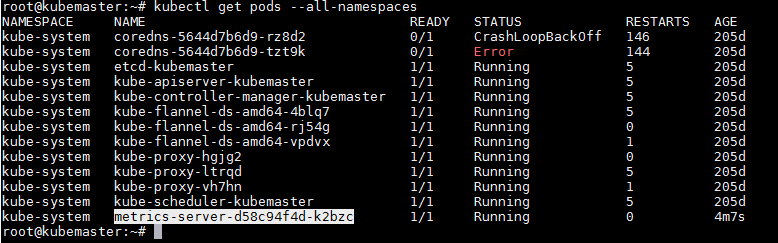
# kubectl get pods --all-namespaces
You will notice that, “metrics-server-d58c94f4d-k2bzc” has been created.
That means we have successfully deployed metrics server.
- Check the utilization of PODS with below command:
root@kubemaster# kubectl top pod
NAME       CPU(cores)   MEMORY(bytes)
elephant   13m          4Mi
lion       953m         0Mi
rabbit     974m         0Mi
root@kubemaster#
- To check the utilization of the node check with below command:
root@kubemaster# kubectl top node
NAME     CPU(cores)   CPU%   MEMORY(bytes)   MEMORY%
kubemaster   87m          4%     1282Mi          67%
node01   1994m        99%    1050Mi          27%
So this my short and simple guide on How to Deploy Metrics servers in Kubernetes, hope this will help you. In case you need more information on the same topic follow this link.
View Comments (0)